We have explained the basics for calculating the range in the last block posts. The free space attenuation, line of sight and also the prediction of wave propagation on the Hata model are part of the simulation software of the following chapters. Hot air balloons are often used in the unlicensed band to show the range of the radio signal. We will also pick up the propaganda with hot-air balloons and explain their range. With the hot air balloons we can explain at best the free space attenuation. But real life is on the ground. We do not live in tents but in brick and cement houses. In Germany, typical applications such as energy meters for electricity and gas are usually found in the basement of buildings. Energy meters in cellars are an extreme LPWAN application. Also the bicycle in the garage or the dog on the sofa are attenuated by the wall of the garage or the wall of the building. In the blog posts about the basics you can read how to calculate this attenuation of the walls. The learned is now used in the simulation. As we learned in the last lesson, the molecules in the air already form an attenuation for the radio wave. The surface of the earth, the condition of the surface and/or structure of the surface form likewise a attenuation of the radio waves. In addition, there are buildings or trees.
To explain the wave propagation by usng of simulation software we plan a radio tower with a height of 25 m in the middle of the North Sea. Then we plan the same radio tower in the city Neustadt am Rübenberge. The region around Neustadt is relatively flat and borders on the inland sea Steinhuder Meer. In order to hide the topography in this observation, we have placed the antenna mast with a height of 25 m in the North Sea near the island of Helgoland. Helgoland is a German island in the North Sea. The radio tower in the middle of the North Sea has the best conditions for the propagation of radio waves. This ideal example shows how far a radio wave can travel without any restrictions due to hills, vegetation or buildings.
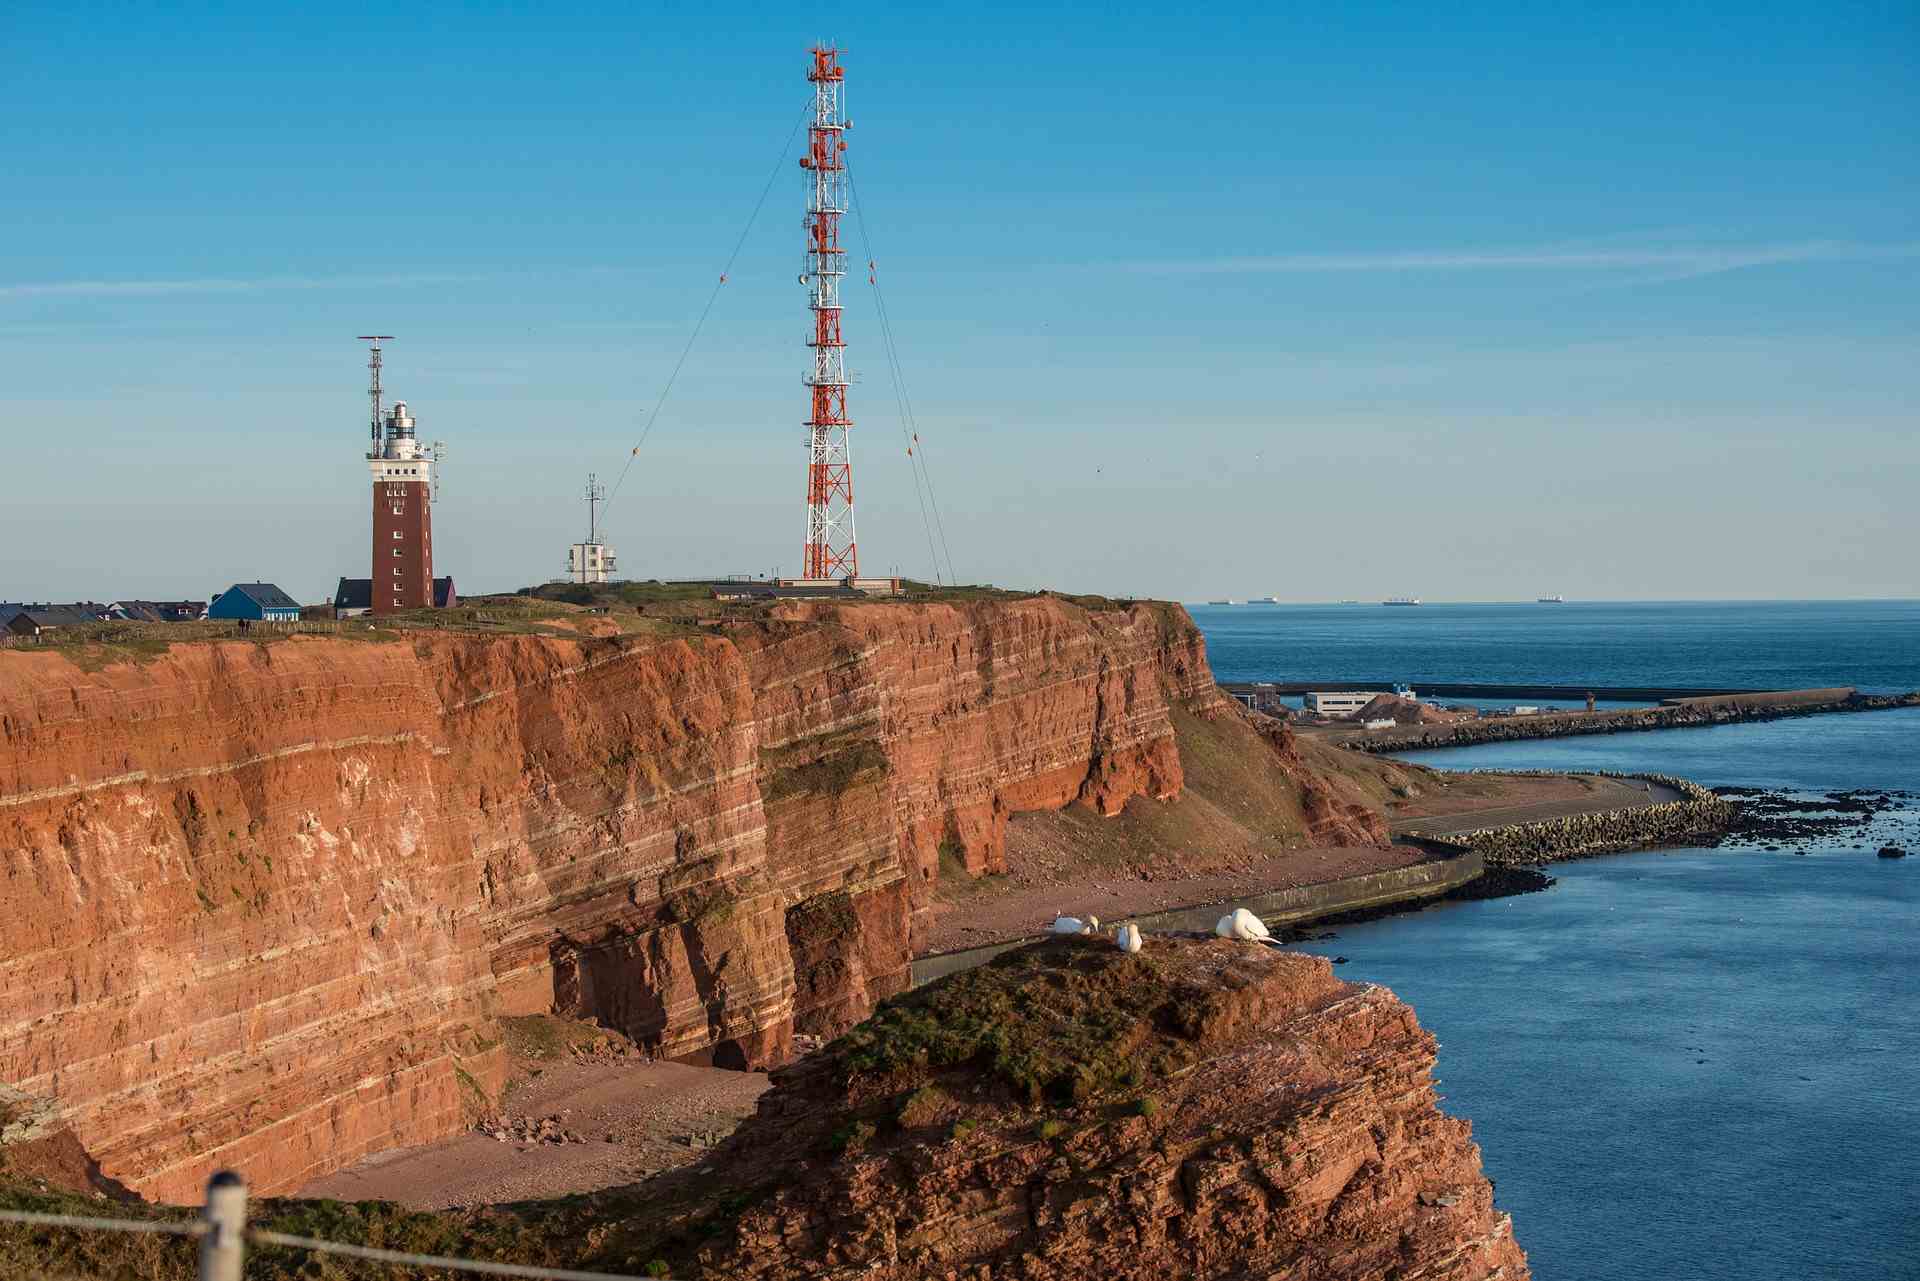
Helgoland – Island in the North Sea
Helgoland is 40 km away from the continent and has an area of less than two square kilometres. Until 1890 Helgoland was part of Great Britain and before that part of Denmark.
In the simulation, the water of the North Sea forms a planar surface, including the terrestrial curvature. The surface of water has a lower attenuation than, for example, the moor or the meadows in the area of Neustadt am Rübenberge. This means that the range we have achieved in the North Sea is an extreme that we cannot achieve in the real area of Neustadt. The region around Neustadt is very flat, but also no salt desert.
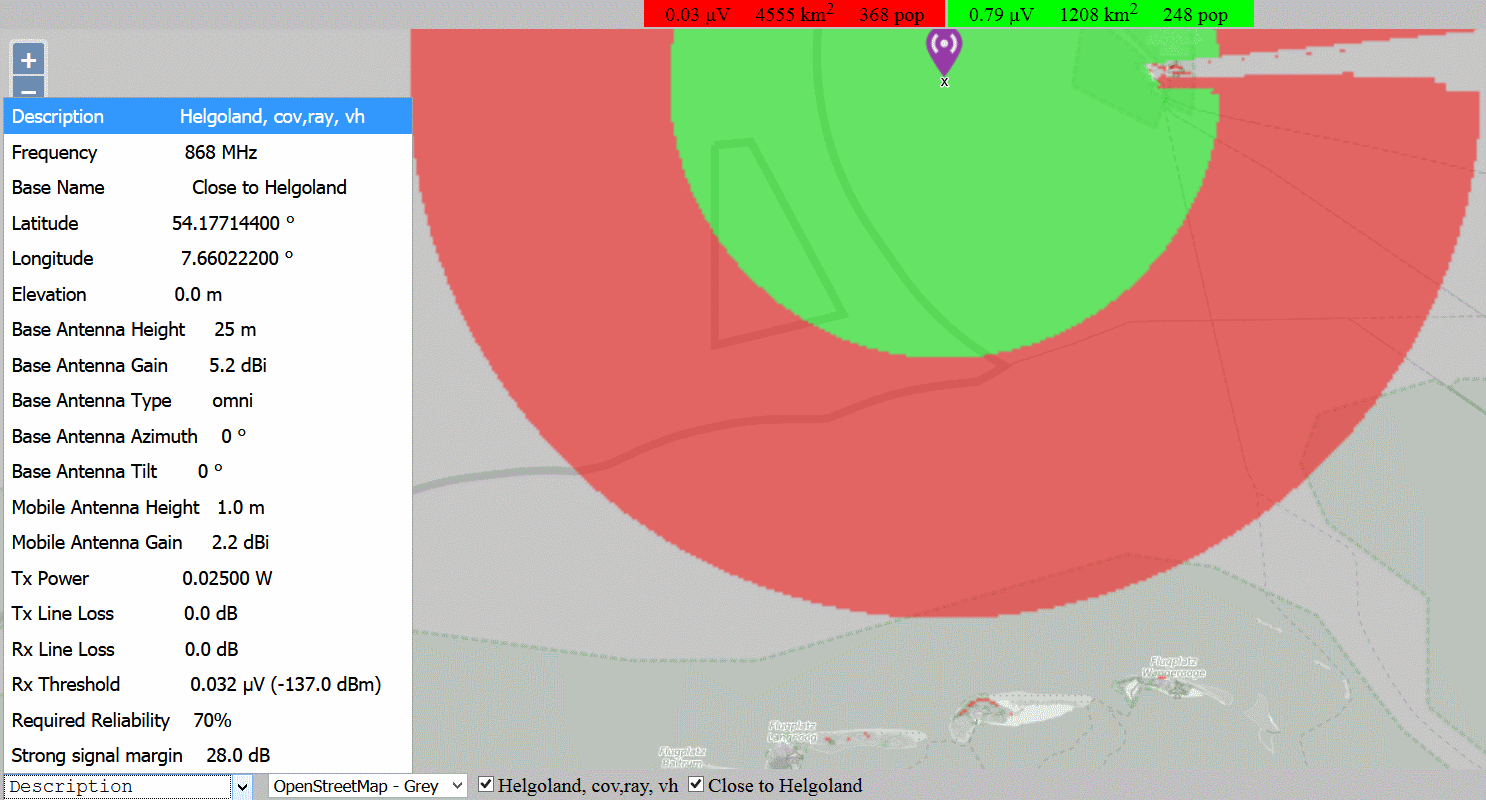
LPWAN simulation near the island Helgoland in the North Sea
Key data for the simulation:
– Height of the gateway antenna = 25 meters
– Height of sensor antenna = 1 meter
– Sensor output power: 14 dBm
– Antenna gain sensor: 2.15 dBi
– Sensitivity Gateway: -137 dBm
– Antenna gain gateway: 5.15 dBi
– Sum of all profits and losses (link budget): 158.3 dB
Selected losses in the simulation:
– Margin, sum of the path loss through the first wall and fading: 28 dB
– Link budget minus loss in the wall and fading: 130.3 dB
We stay with the values used at the chapter about the link budget. Areas with possible indoor coverage are marked in green. As soon as the maximum attenuation of 28 dB is exceeded, the software marks the area with the colour red. East of the 25 m high antenna mast in the North Sea is the island of Helgoland. The island forms a radio shadow and leads to the fact that behind the island no more reception is possible. The radio wave propagation in the simulation software is based on the Longley-Rice model.
The program calculates the refraction of radio waves at the tops of hills and mountains. Thus, the reception behind the hills and mountains is also visible. The cliffs of the island Helgoland show this clearly. A part of the island, already marked red, is only reached by refraction. We will come back on the refraction later in detail.
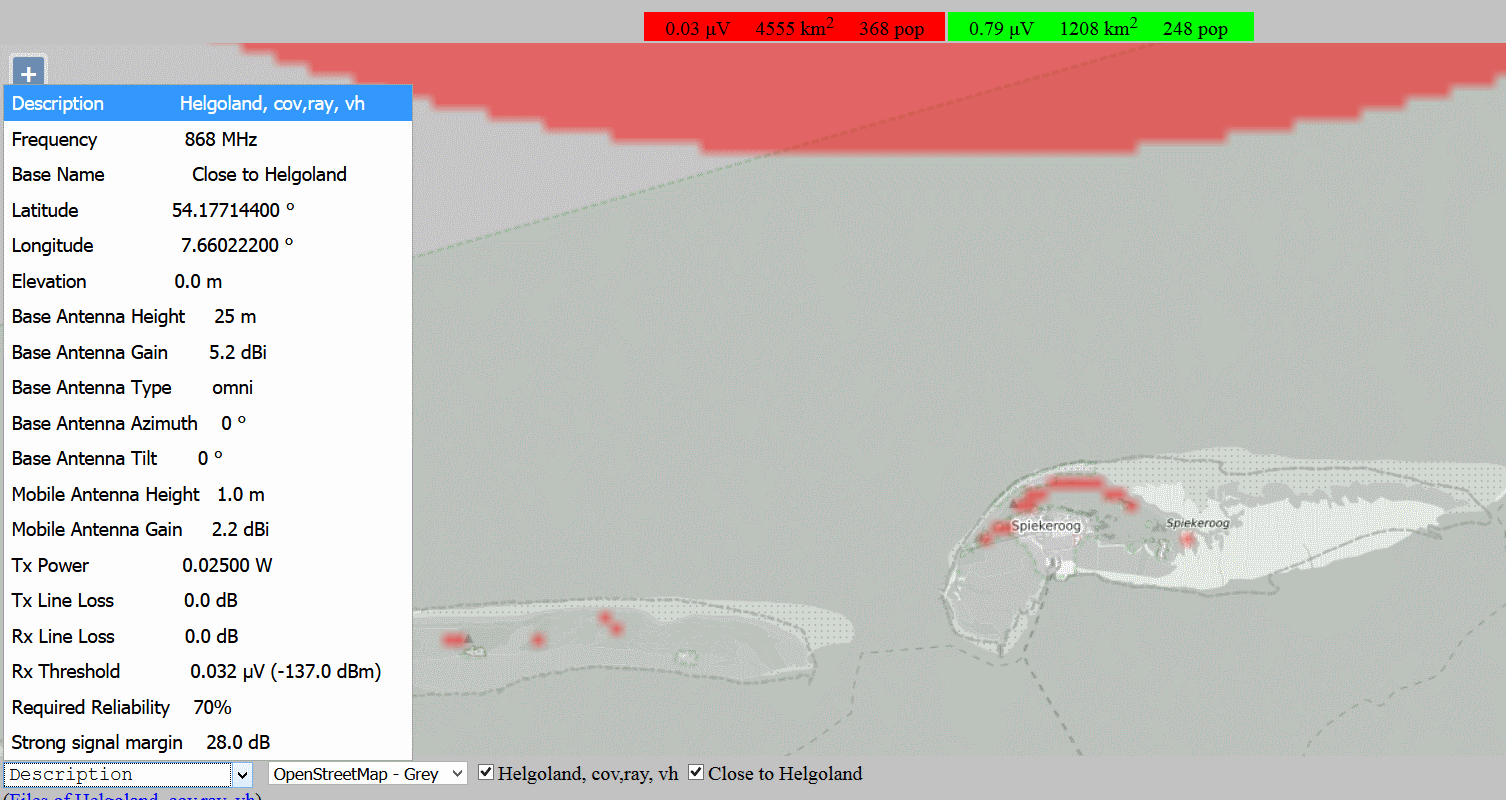
Frisian Islands covered by LPWAN
In the south of the antenna mast are the Frisian Islands. The minimal increase of the islands leads to the fact that a reception is still possible in the outside area on the island. A few kilometres before the islands, the radio link departs through the earth’s curvature and the high points of the islands are just reached in this way.
In the next sections we will explain in detail all the parameters that can be set during the simulation and the results of the simulation of the relatively simple test environment in the middle of the North Sea.
The hypothesis suggests that the radio wave propagates in a straight line like light. However, in reality, the refractive properties of the Earth’s atmosphere cause the radio wave to move in a curved direction towards the Earth’s surface. This curved pathway makes it difficult to manually identify the sufficient clearance from physical barrier by using a paper map. In order to calculate this curved propagation path, a correction factor k is applied to the earth’s radius, which increases or decreases the surface curvature to compensate for the curved path. This corrected radius is called the effective earth radius. The k-factor, from which the effective earth radius is calculated, is a function of the refractive index of the atmosphere. For a non-refracting atmosphere in which the propagation path is a straight line, k = 1. However, for the more realistic atmosphere in which the propagation path is curved towards the Earth’s surface, k > 1. For rare cases in which the propagation path is curved towards the surface, k < 1. In the near of a large desert, the k factor is < 1. Values of k may vary depending on geographic region, season, and local weather conditions. The general value for the k-factor is 1.33.
Effect of the K factor in the simulation of the LPWAN in the North Sea
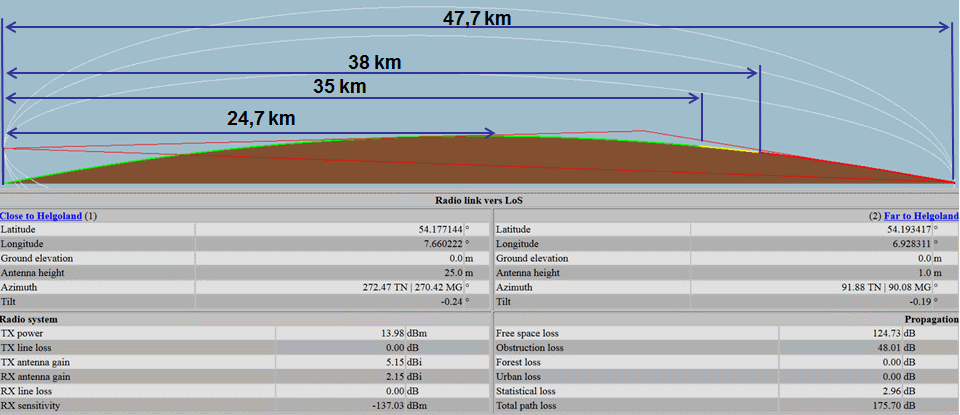
LPWAN close to Helgoland radio link
For the locations in the simulations, we use speaking names so that we can easily remember them in further simulations. In this case both locations are called “Close to Helgoland” and “Far to Helgoland”. “Close to Helgoland” will be picked up again in further simulations.
The fact that the simulation software works with a K-factor of 1.33 is shown when we compare Line of Sight (LOS) with the calculated range in the simulation in the North Sea. The 47.7 km distance between the two antennas was randomly chosen. At a distance of approx. 40 km, we can quickly calculate for ourselves that the maximum range can be expected with a 25 m high antenna mast for the gateway and a 1 m high location for the sensor. With an antenna 25 m and 1 m high, LOS will be 23.7 km. If we multiply the 23.7 kilometers by 1.33 then that results in a distance of 31.5 km. The 35 km and 38 km distances shown in the graph were converted manually as percentages. This can lead to minor errors due to the readout and recalculation. Nevertheless, the difference of 31.5 km with the factor 1.33 and 35 km is already 11 %. It is well known that a flat surface on land allows a different wave propagation than a flat surface on water. As the general factor of 1.33 applies to land surface, it can be assumed that the software has already used an adapted k-factor. The simulation software knows not only the topography but also the vegetation and buildings. The graph with the cut model above clearly shows that the radio wave extends further than we can view with our eyes. Depending on the nature of the surface, the software therefore uses a corresponding K factor. If we plan an LPWAN in Saudi Arabia or Egypt, the k-factor of 1.33 may have to be adjusted downwards. The following simulations and explanations always
Summary LPWAN of the middle of the North Sea
The graphic clearly shows that the simulation software calculates a higher range than the Line of Singh. The so-called K factor, which influences the diffraction of the radio wave depending on the atmosphere, is taken into account.
References
- Longley-Rice Model https://en.wikipedia.org/wiki/Longley%E2%80%93Rice_model
- Longley-Rice Model https://www.softwright.com/faq/engineering/prop_longley_rice.html
- Determination of Atmospheric Effective Earth Radius Factor (k-factor) Under Clear Air in Lagos, Nigeria http://varepsilon.com/index.php/mse/article/view/14
- The Impact of K-Factor on Wireless Link in Indian Semi-desert Terrain http://citeseerx.ist.psu.edu/viewdoc/download?doi=10.1.1.419.6841&rep=rep1&type=pdf
Anyone who is planning their own private LPWAN is welcome to contact us. We would be happy to explain how to use the software to simulate a wireless network in workshops or online seminars. If you don’t plan your own network and want to use an existing one and want to develop your own PCBs for this purpose, please do not hesitate to contact us. We are happy to share our experience from the numerous LPWAN projects with you. Please send your requests to harald.naumann(at)lte-modem.com