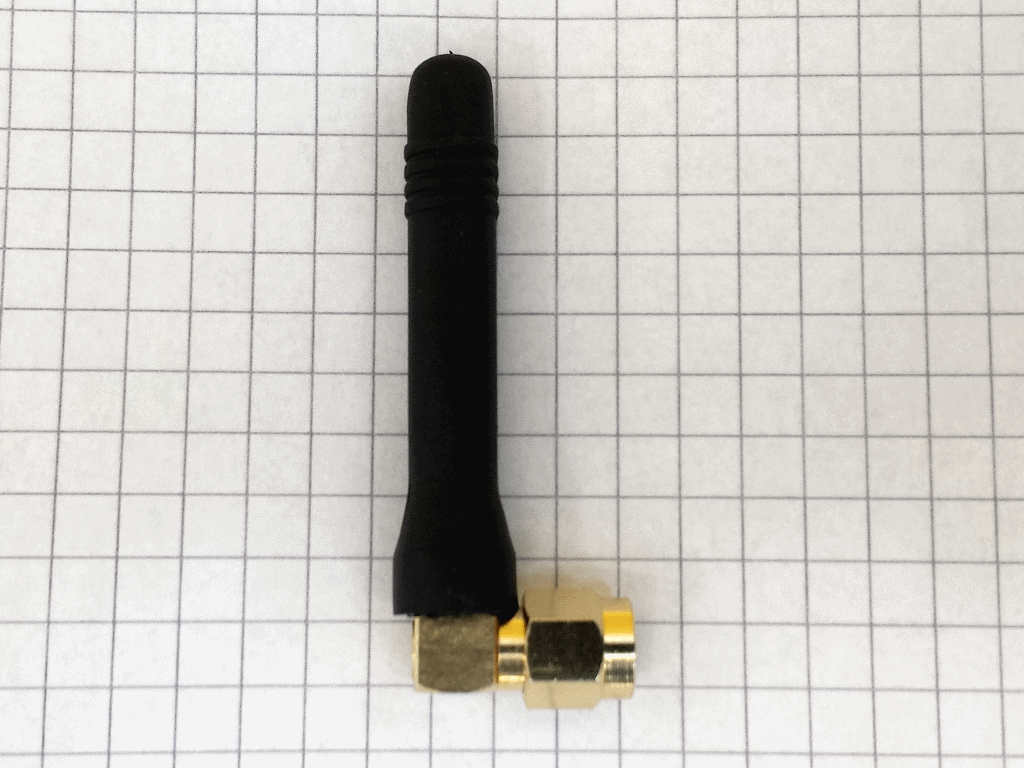
Stubby cellular antenna with right angle SMA – 50 mm x 10 mm
Our second patient has a name as well. The manufacturers have called it the cellular stubby antenna. Further details about the second mobile antenna patient are given in the test below.
Here are the medical records of the cellular stubby antenna:
- Frequency bands: GSM 850/900 MHz, GSM 1800 / 1900 MHz, UMTS 2100
- Frequency range: 824 – 960 MHz and 1710 – 2150 MHz
- VSWR @ 824 – 960 MHz max. 2 or 3 and VSWR @ 1710 – 2150 MHz max. 2 or 3
Return Loss max. in all bands: – 6 dB or -9.5 dB - Dimensions: estimated 50 mm x 10 mm diameter
- Cable: N/A
- Cable length: N/A
- Connector type: SMA right angle
You can find this type of cellular stubby antennas online from different distributors. They promise a VSWR of 2 to 3 in all frequency bands. The manufacturer of the antenna under test is unknown as it was given to me during a customer visit. The customer offers high-end cellular terminals and control units. The customer of this customer wanted to save money and bought the cellular stubby antenna from an unknown third party. After installation they claimed that the cellular terminal on UMTS was subject to a lot of interrupts during transmission. Let us unearth the truth.
Cellular stubby antenna – test in one condition
- Antenna mounted direct to the SMA connector of the VNA
Some initial details:
- VSWR: 2 = Return Loss of – 9.5 dB
- VSWR: 3 = Return Loss of – 6 dB
You can calculate this yourself here http://cgi.www.telestrian.co.uk/cgi-bin/www.telestrian.co.uk/vswr.pl
A VSWR of 2 to 3 is the common minimum for stubby cellular antennas. The shorter the antenna, the worse are the technical parameters. However, even antennas with similar dimensions often show dramatically different RF parameters.
Cellular stubby antenna – on ground plane of the VNA
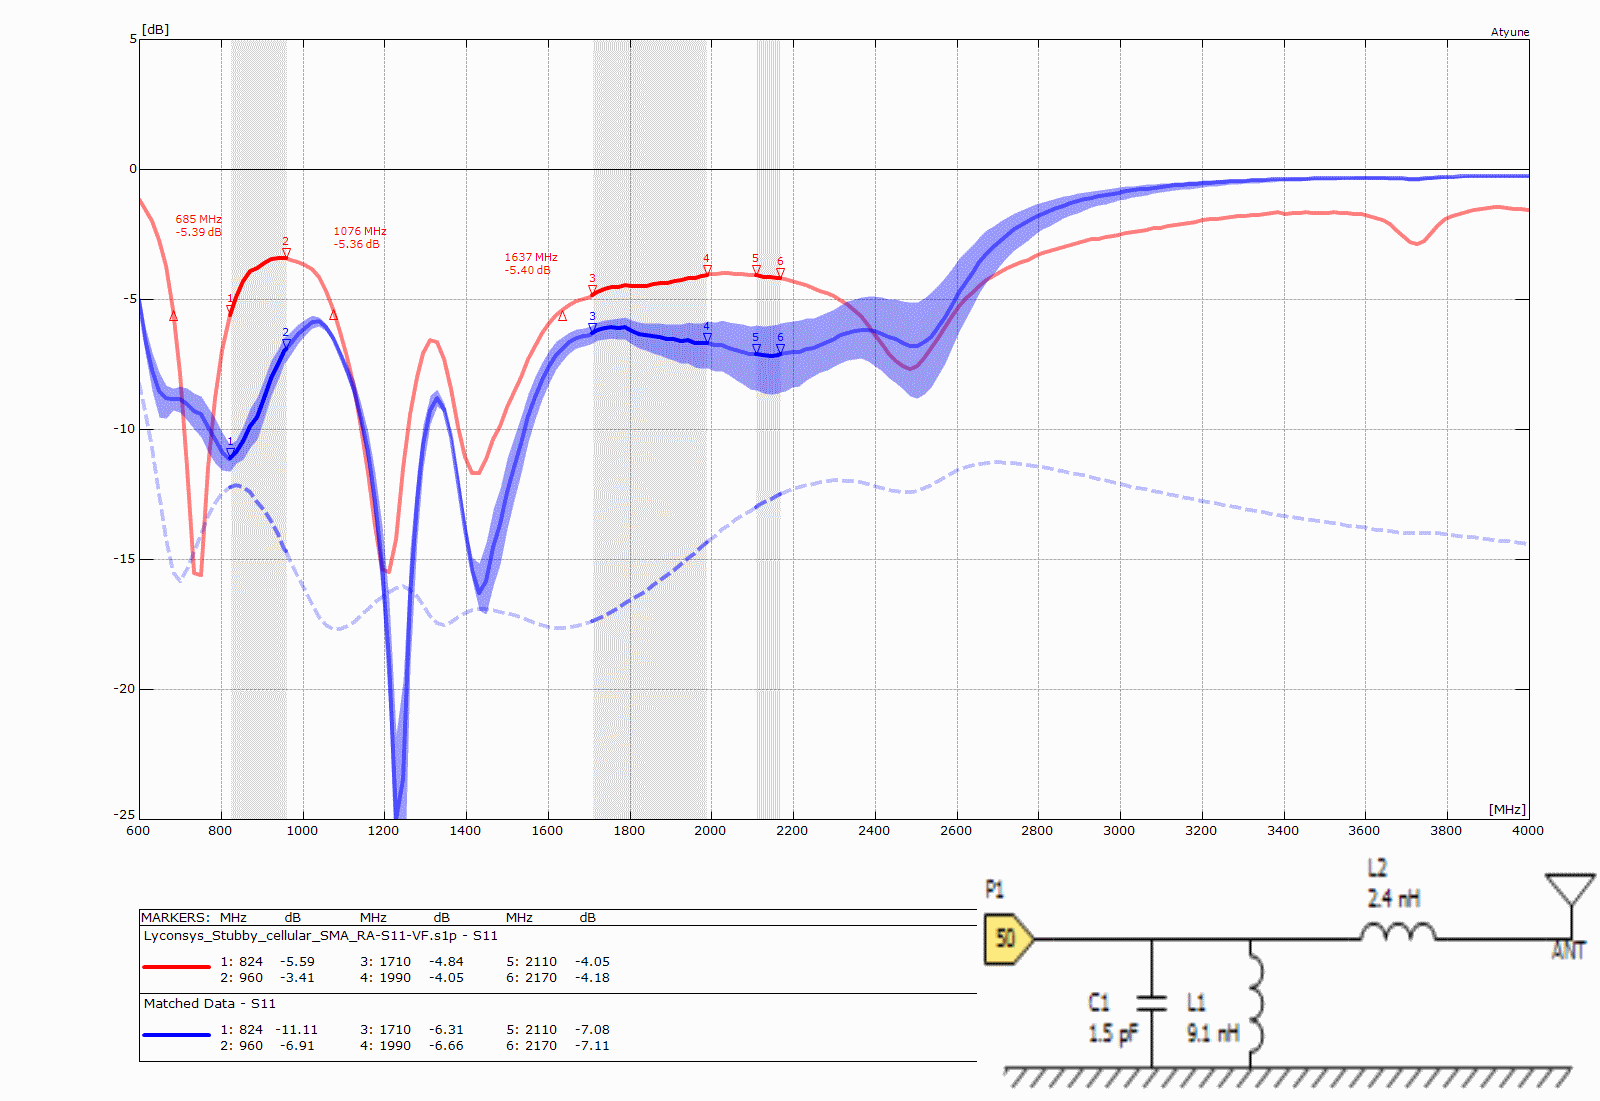
Stubby cellular antenna SMA right angle – 50 mm x 10 mm
Red line not matched
- 824 MHz = RL -5.59 dB / 1710 MHz = RL -4.64 dB / 2110 MHz = – 4.05 dB
- 960 MHz = RL -3.41 dB / 1990 MHz = RL -4.05 dB / 2170 MHz = – 4.18 dB
Blue line matched with three components
- 824 MHz = RL -11.11 dB / 1710 MHz = RL -6.31 dB / 2110 MHz = – 7.08 dB
- 960 MHz = RL -6.91 dB / 1990 MHz = RL -6.66 dB / 2170 MHz = – 7.11 dB
A test connected to the ground plane of the VNA is close to actual field performance because the area of the ground plane of the VNA is estimated to be 80 mm x 140 mm and it is therefore acceptable as a quick check. If the cellular stubby antenna does not show resonance in the promised bands or close to the promised bands then it makes no sense to use it in your IoT application. The red line shows the Return Loss without matching circuit and the blue line shows the Return Loss with a simulated matching circuit.
In the right corner the graphic shows the schematic diagram with a matching circuit based on components from Murata (SMT 0402). After automatic simulation of the matching circuit I calculated C1 = 1.8 pF, L1 = 9,1 , L2 = 2.4 pF. Please click on the picture to enlarge it and to see more detail. The grey zone in the graph marks the frequency range where the antenna should be resonant.
A stubby cellular antenna can be replaced by another stubby cellular antenna or any other kind of monopole antenna. It is important to note that a matching circuit for a particular stubby antenna only makes sense if nobody is able to replace the matched antenna to another antenna which in all likelyhood will have different characteristics. The simulated matching circuit is therefore valid for one type of stubby antenna only. Nevertheless, with the blue line I show that a matching circuit is able to optimise a selected antenna.
The Return Loss graph shows some more markers set manually. I tried to set the markers on – 6 dB, but the markers will always jump to the next measured value in the table behind the graph. At 685 MHz the marker is on -5.39 dB, at 1076 MHz the marker is on 5.36 dB and at 1637 the marker is on -5.40 dB. The automatic set marker 1 was already on close to – 6 dB. I saved to set one further. At 824 MHz the marker is on -5.59 dB.
The gap between two – 6 dB or – 9.5 dB markers is called the -6 dB or -10 dB bandwidth. A – 10 dBm bandwidth, equal to a VSWR of 2, is the goal of any antenna designer. Embedded cellular antennas mounted to your PCB, PCB antennas with coaxial cables or some cellular stubby antennas will show a -6 dB bandwidth and are not capable of reaching the -10 dB bandwidth.
Necessary bandwidth in cellular bands
- Bandwidth in GSM 850/900 => 960 MHz – 824 MHz = 136 Mhz
- Bandwidth in GSM 900 => 960 MHz – 880 MHz = 80 Mhz
- Bandwidth in GSM 1800/1900 = 1990 MHz – 1710 MHz = 280 MHz
- Bandwidth in GSM 1800 = 1880 MHz – 1710 MHz = 170 MHz
- Bandwidth in UMTS 2100 = 2170 MHz – 2110 MHz = 60 MHz
- Bandwidth GSM1800/1900 + UMTS 2100 = 2170 MHz – 1710 MHz = 460 MHz
If you have a need for dual band GSM only, then the bandwidth of 80 MHz for GSM 900 and 170 MHz is much easier to cover than the quad band GSM plus UMTS 2100 with its 136 MHz at the lower band and 460 MHz at the higher bands.
Bandwidth of the tested cellular stubby antenna
- Bandwidth of lower band 824 MHz – 685 MHz = 139 MHz
- Bandwidth of the higher band = 1637 MHz – 1076 MHz = 561 MHz
The bandwidth for the lower and higher cellular bands looks perfect, but the – 6 dB gap is on completely the wrong frequencies. The stubby cellular antenna is mounted to a UMTS MiniPCIe module. UMTS 2100 on 2110 MHz to 2170 MHz is the major band. They selected UMTS to take advantage of the high upload speed. However, in the UMTS band the antenna shows an Return Loss of – 4.05 dB only. The poor Return Loss is therefore the reason for the interrupts in the transmission. The replacement of the cheap antenna with a new and better antenna plus the consulting by email and phone overcame the problems.
Some quick questions to consider:
- Why did the manufacturer of the antenna ship completely detuned antennas?
- Why did the customer of the customer take the risk and order a cheap component from an untested source?
- Why did the customer of the customer perform no quality conformance test for the antennas it used in the final design?
Your cellular antenna – mounted to your final enclosure
Your final solution will surely be different from these test conditions. If we test the same cellular stubby antenna in your unique environment, then we would expect to get a different result.
The result will affected by, for example:
- Size of the ground plane of the environment
- Metal close to the stubby cellular antenna
If your environment has a lot of metal close to the antenna, then the antenna that looks to be a perfect choice based on its data sheet or tested in the above conditions may perform poorly in your special environment. Based on this fact, I came to the conclusion that an antenna test service would be a valuable offering. During my customer visits I am able to offer you a quick test, often free of charge. I will come with my mobile vector network analyser (VNA) to your office. The cellular antenna in this article was tested at the customer site. To power on the mobile VNA and the laptop I need a few minutes. The VNA has a self calibration on its SMA adapters. The calibration takes only few seconds. If this task is done I can test several antennas in a row for you very quickly. The analysis of the graph does take much more time then the measurement itself.
If you have a patient for the Antenna Hospital or the Antenna Ambulance then do not hesitate to drop an email to harald.naumann (at) gsm-modem.de