The upper left graph illustrates the measurement of a filter with two ports at the Vector Network Analyser (VNA). Port 1 is feeding the device under test and is measuring the reflection. Port 2 is measuring the received energy. The lower right graph is showing a typical return loss measurement of an antenna.
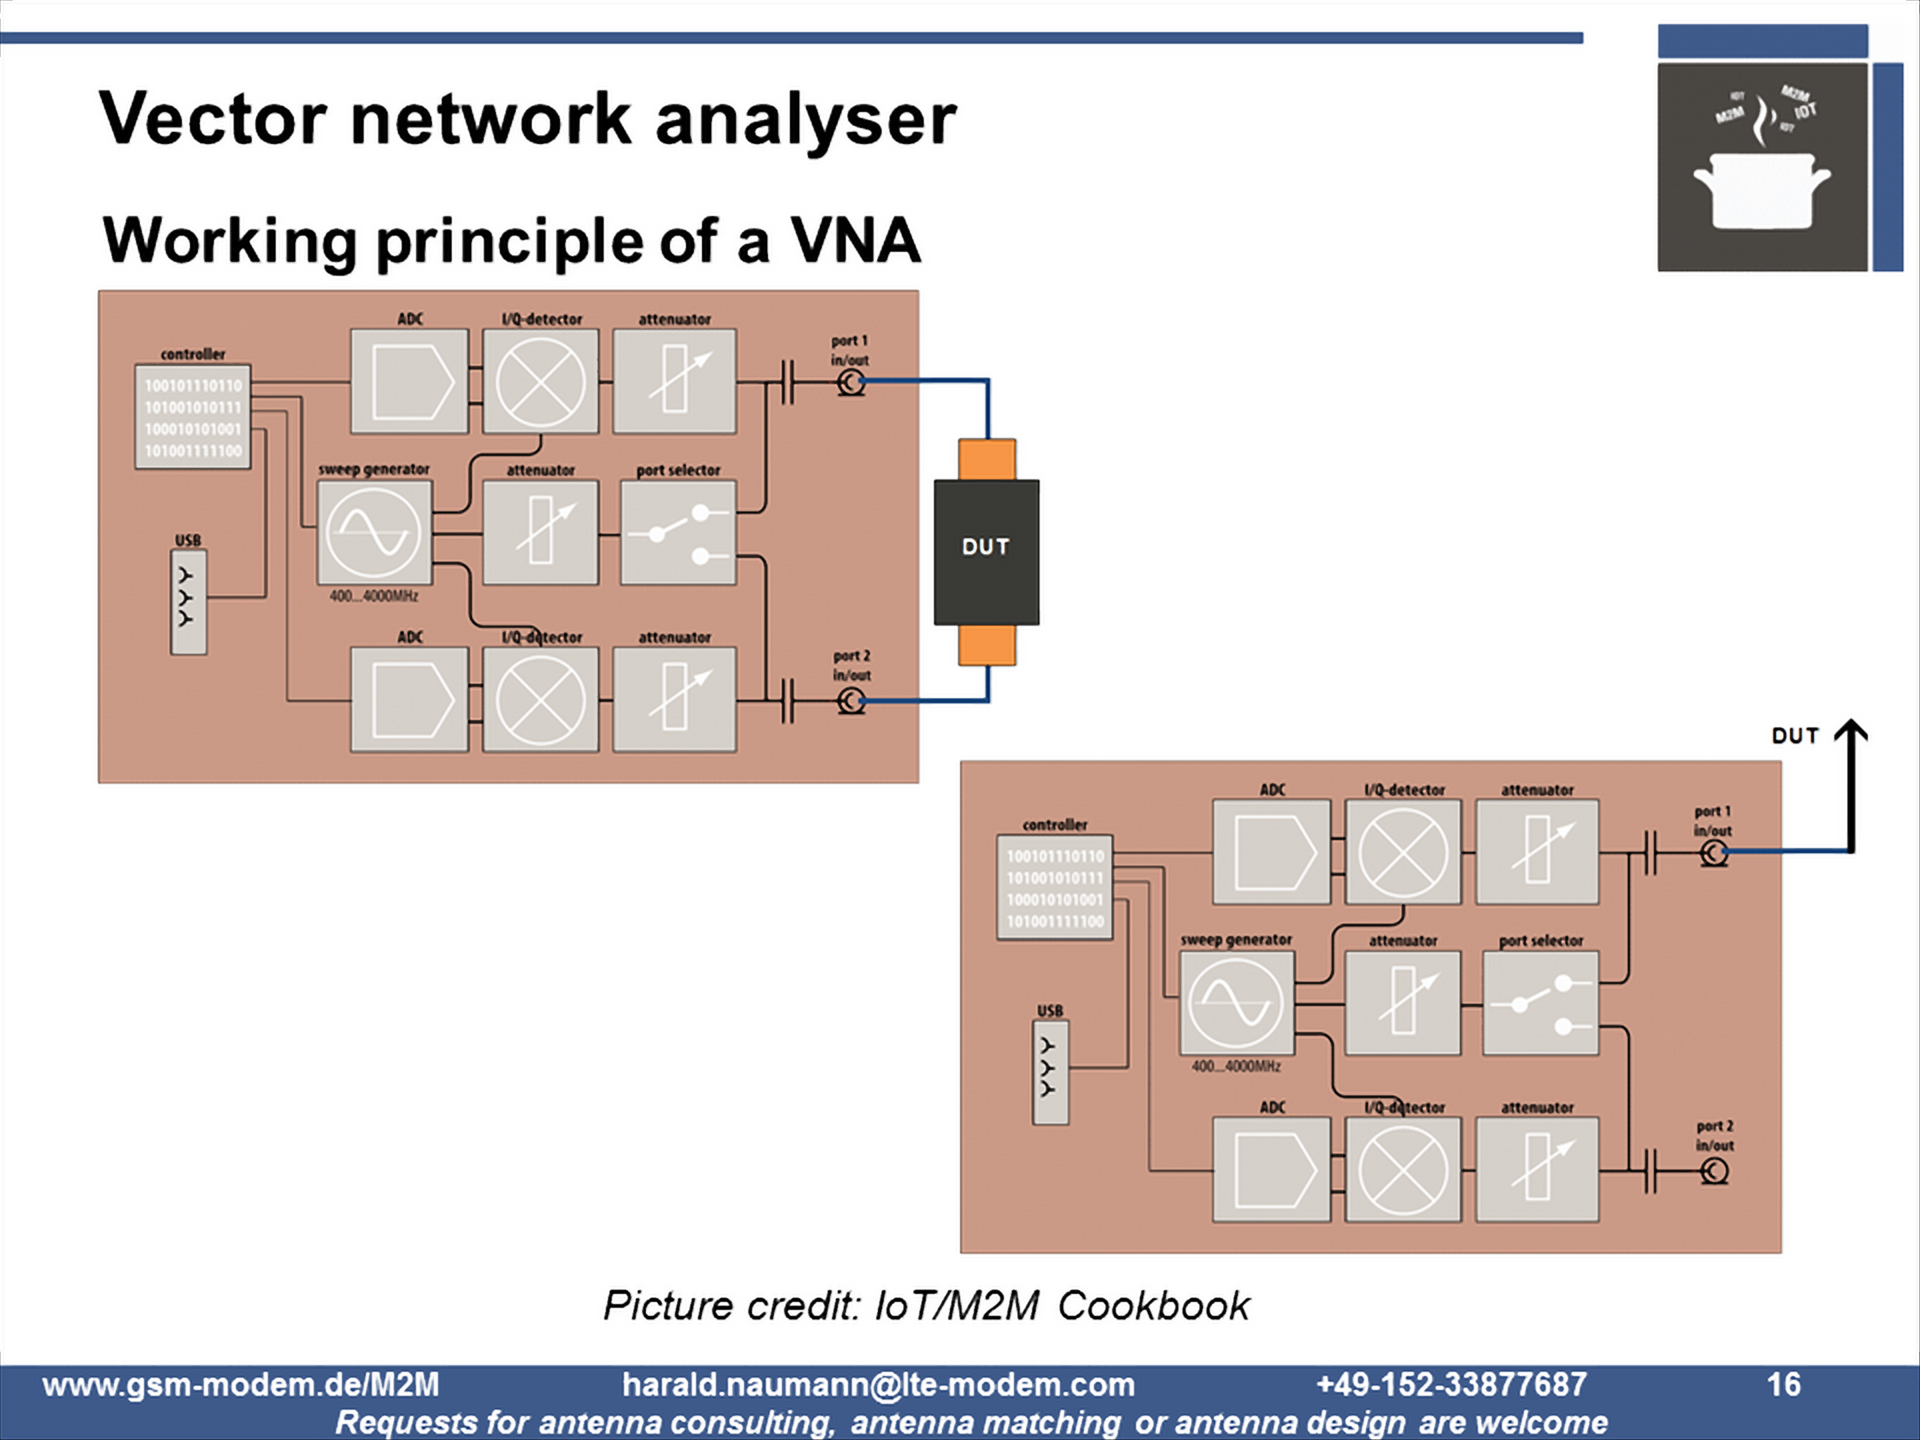
Antenna Return Loss by Vector Network Analyser (VNA)
Has this article series piqued your interest? Do you plan your own LPWAN IoT device? Do you plan to deploy IoT devices with embedded antennas? Do you have an IoT prototype and need to optimise the design or minimise the price? If you have answered “YES” to any one of these questions then please do not hesitate to drop an email to harald.naumann (at) lte-modem.com and to ask for a proposal or some engineering services to make your IoT idea a cost-effective reality.